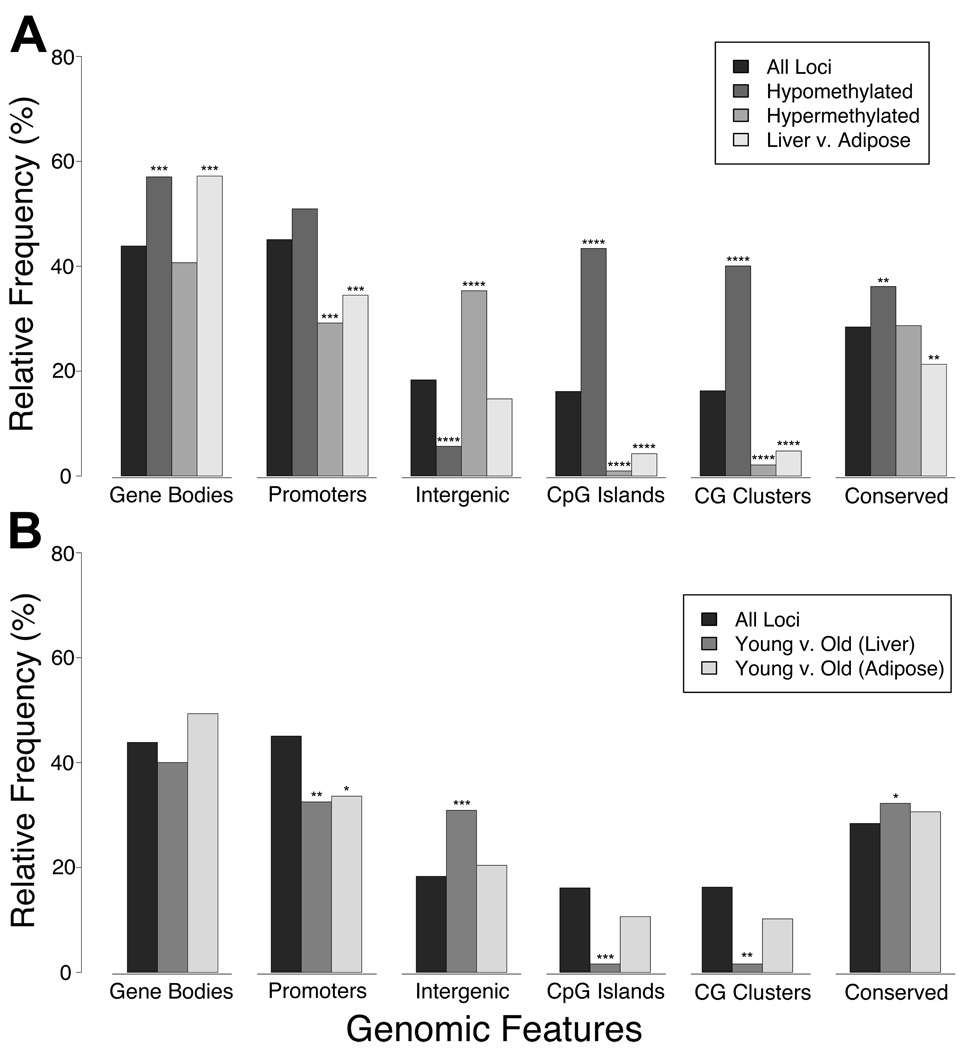
Figure 5. Genomic distributions of DNA methylation in normal and aging tissues.
HELP data were divided into five different subsets representing constitutively hypomethylated loci, constitutively hypermethylated loci, and tissue-specific differentially-methylated regions (DMR, Liver compared with Adipose) in panel (A), as well as age-related DMRs (Young compared with Old) specific to either liver or adipose tissue in panel (B). Overlap of these subsets with six different genomic features (gene bodies, promoters including 10 kb upstream of transcription start sites, intergenic regions, CpG islands, CG clusters, and conserved non-coding elements) was measured and is shown from left to right in both panels. We also show genomic distributions for the whole microarray (All Loci, both panels), and are thus able to determine if a given subset of HELP data is enriched or depleted for any given genomic feature beyond what one might expect to see by random chance. Many of the differences shown are associated with negligible probability that they might occur with random sampling of the data (tailed hypergeometric distribution; *, **, ***, and **** indicate P<1%, P<0.01%, P<0.00000001%, and P~0, respectively) (Supp. Table 2).

