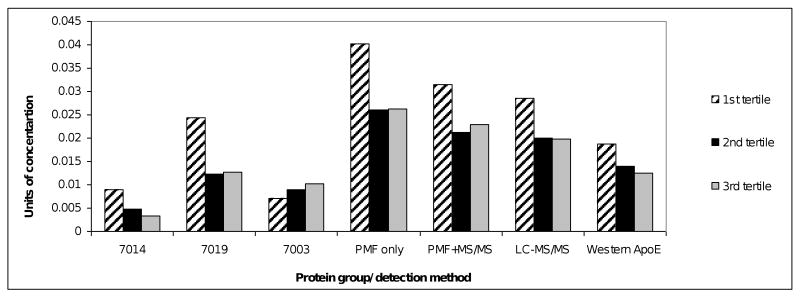
Figure 3.
Concentration of Apolipoprotein E across Pb tertiles using different detection methods. Groups 7014, 7019, 7003 on 2D-PAGE were identified as significantly associated with Pb tertiles, identified by PMF only; the sum of % protein intensities are added for PMF only bars; 7019 and 7003 were confirmed by LC-MS/MS, the sum of those two groups is shown in PMF+MS/MS bars; LC-MS/MS percent intensity of ApoE concentration was multiplied by 10 to fit the scale of the graph; Western blot units of ApoE concentration were multiplied by 10-9 to fit the scale of the graph.

