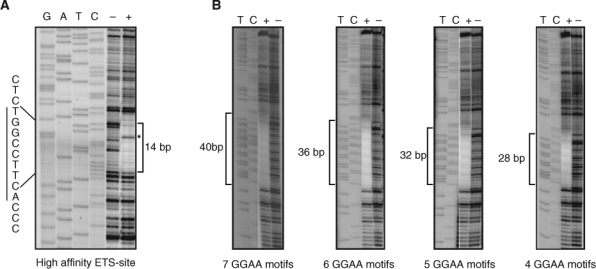
Figure 3.

DNAse I footprinting assays reveal differences between high-affinity and GGAA-repetitive DNA sequences. (A) The positive control DNA duplex (I) with a single high-affinity ETS binding site shows an approximately 14-bp footprint (marked by a bracket) in the presence of Δ22 protein (marked by “+”) as compared to in the absence of protein (marked by “–”). The characteristic hypersensitive site is marked by an asterisk. Sequencing lanes are indicated by “GATC.” (B) DNA containing the indicated number of consecutive GGAA motifs demonstrates larger protected regions, as indicated by brackets. The DNA probes contained the following protected sequences (labeled strand indicated): AGCT(TTCC)4-7TGCAGCCC.
