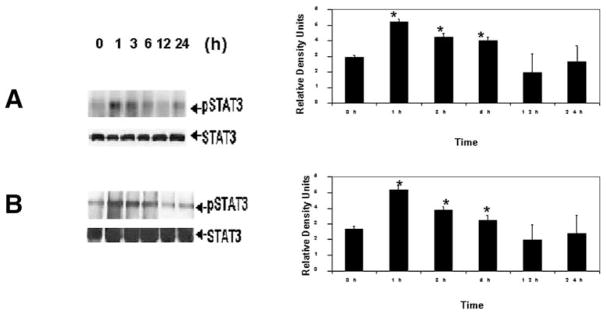
Fig. 5.
Immunoprecipitation of pStat3 in stellate cells exposed to leptin. One microgram of polyclonal antibodies to pStat3 was added to (A) primary cultured HSCs or (B) HSC-T6 as described in detail in Materials and Methods. Equal protein loading28 was confirmed based on expression of total, unphosphorylated Stat3 (STAT3 in figures). Lanes 2 to 6 indicate leptin exposure for the times indicated in hours for either primary HSCs (A) or cell culture model (B). The corresponding histograms compare pStat3 from leptin-treated HSCs with untreated HSCs and are from 3 independent experiments performed in triplicate. Data analysis comparing pStat3 in leptin-treated cells for each time point vs. untreated (Lane 1, control [C]) HSCs was by Student’s t test. *P < .05.

