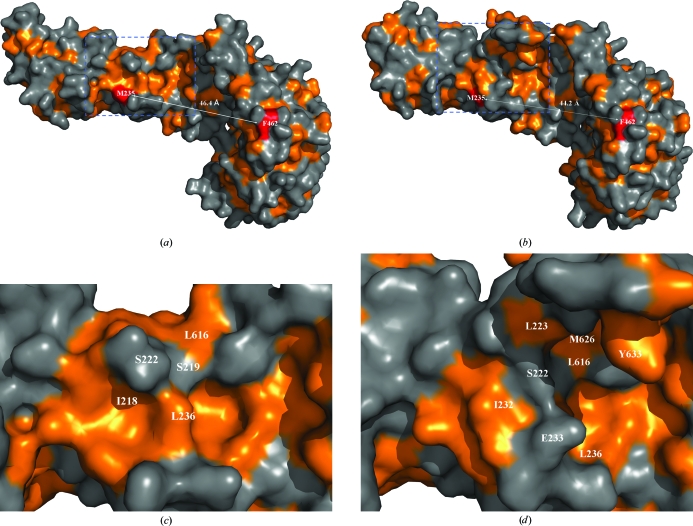
Figure 2.
Hydrophobicity drawings of Tom71 structures. (a) Hydrophobicity drawing of Tom71_old. The orange color denotes the hydrophobic patches. The distance between Met235 and Phe462 is shown as a dotted line. The exposed surfaces of Met235 and Phe263 are shown in red. (b) Hydrophobicity drawing of Tom71_new. The distance between Met235 and Phe462 is shown as a dotted line. (c) A magnified version of the area within the blue box in (a). (d) A magnified version of the area within the blue box in (b). Some residues around Ser222 and Glu233 are labeled.

