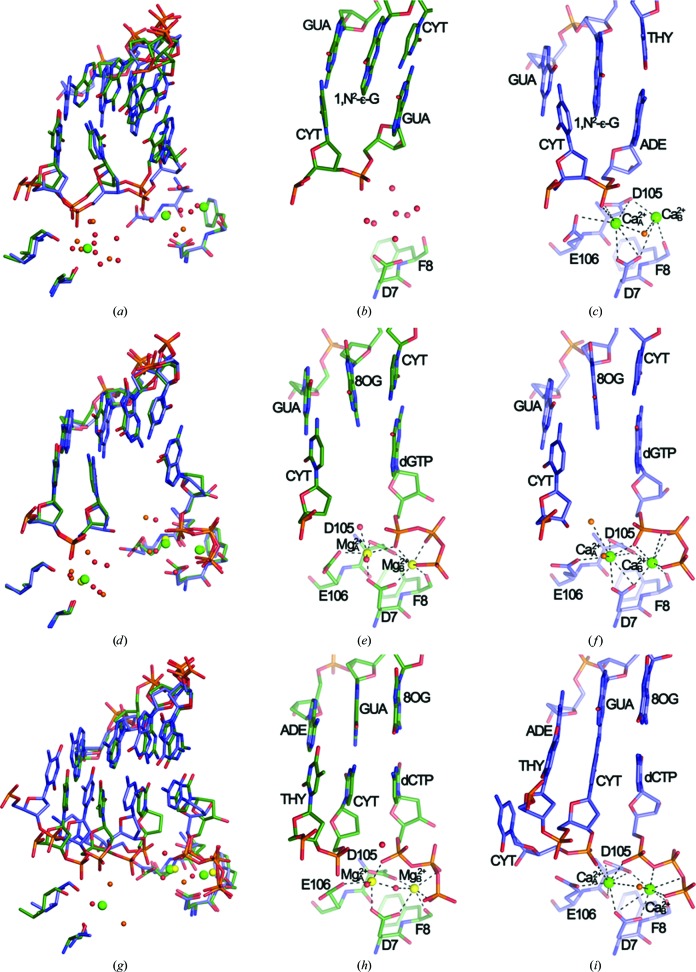
Figure 1.
Dpo4 Mg2+-form versus Ca2+-form complexes. (a) Superimposition of the binary Dpo4–Mg2+ (green) and Dpo4–Ca2+ (blue; PDB code 2bq3) complexes. The active sites of the binary Dpo4–Mg2+ (b) and binary Dpo4–Ca2+ (c) complexes are shown. (d) Superimposition of the Dpo4–dGTP–Mg2+ (green) and Dpo4–dGTP–Ca2+ (blue; PDB code 2c22) complexes. The active sites of the Dpo4–dGTP–Mg2+ (e) and Dpo4–dGTP–Ca2+ (f) complexes are shown. (g) Superimposition of the Dpo4–dCTP–Mg2+ (green) and Dpo4–dCTP–Ca2+ (blue; PDB code 2c2e) complexes. The active sites of the Dpo4–dCTP–Mg2+ (h) and Dpo4-dCTP-Ca2+ (i) complexes are shown. Mg2+ ions are shown as yellow spheres and Ca2+ ions are shown as green spheres. Water molecules in the Dpo4–Mg2+ and Dpo4–Ca2+ complexes are shown as small red and orange spheres, respectively.

