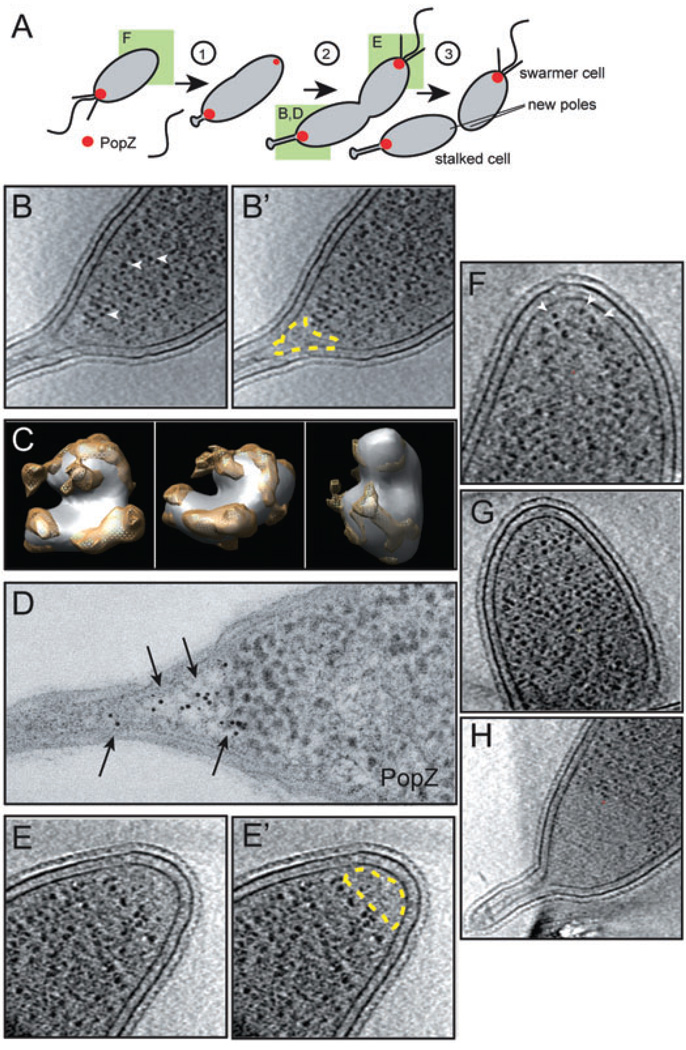
Fig. 1. PopZ establishes a ribosome exclusion zone at the cell poles.
A. A schematic of cell division in C. crescentus. PopZ localization is represented in red, and the poles shown in other panels are denoted by a green box.
B. An individual section from a three-dimensional reconstruction of a Cryo-EM tomogram of a wild-type cell preserved in vitreous ice, showing a stalked pole, with the ribosome exclusion zone outlined in yellow in B′. Examples of individual ribosomes are marked by arrowheads.
C. The high contrast globular particles observed in Cryo-EM tomograms are ribosomes. The averaged structure of the dense globular particles found in C. crescentus cytoplasm (white) is overlayed on the structure the E. coli ribosome (yellow) revealing similarity in size and shape. Three different angles of rotation are shown.
D. Immuno-gold labelling of PopZ (arrows) at the stalked pole of a wild-type cell.
E. A Cryo-EM section of a flagellated pole, with the ribosome exclusion zone outlined in yellow in E′. The flagellar motor was clearly visualized in a different section of this data set (not shown).
F. A new pole in a swarmer cell (Cryo-EM). Dense, ribosome studded cytoplasm extends to the membrane (arrowheads), an observation repeated in over 30 cells.
G. A cell pole in a ΔpopZ cell (Cryo-EM), strain GB255, with ribosome studded cytoplasm extending to the membrane.
H. A stalked pole of a PopZ overproducing cell (Cryo-EM), strain GB123 (top panel), exhibiting an enlarged ribosome exclusion zone. PopZ overproduction was stimulated by growth in 0.3% xylose for 4 h prior to freezing.

