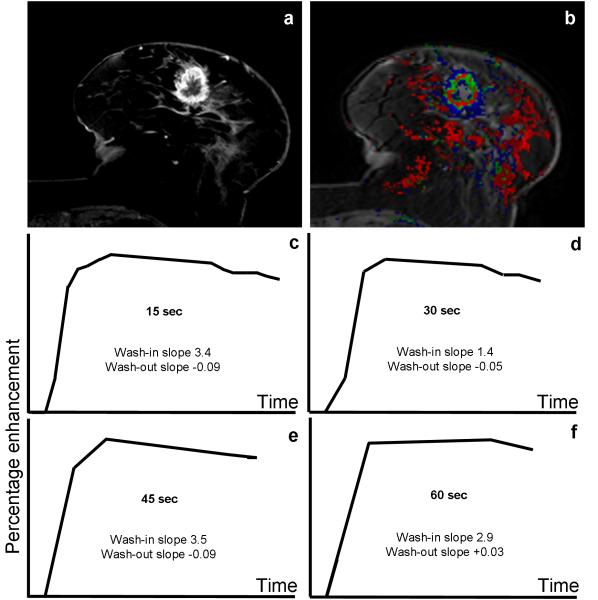
Figure 6.
DCE MRI of 77 year-old female with a history of right breast cancer treated with conservative breast surgery, presented with a new left breast mass. a) High spatial-resolution subtraction image showing a spiculated, rim-enhancing mass lesion at the 6 O’clock position of the Lt. breast. b) A color map of the corresponding 15 sec/acquisition temporal resolution dynamic series showing the lesion exhibiting green and red colors (denoting intermediate and high levels of suspicion for malignancy). C-F) Kinetic curves for different temporal resolution datasets for the lesion. The kinetic curve shape was washout (type III) for the 15, 30 and 45 second/acquisition acquisition data, but was plateau (type II) for the 60 second/acquisition temporal resolution data. Histo-pathologic examination of the lesion revealed infiltrating ductal carcinoma with foci of DCIS.

