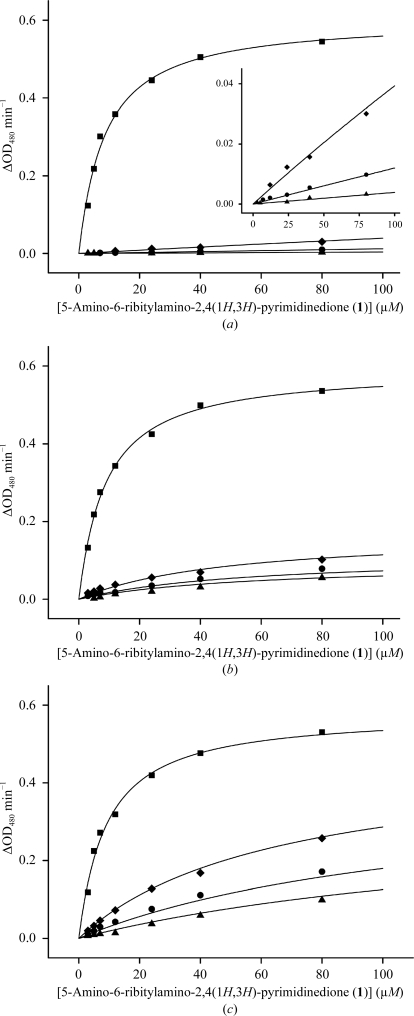
Figure 5.
Kinetics plots for the inhibition of B. anthracis LS by the following inhibitors: JC33 (a), TS23 (b) and JC72 (c). The inhibitor concentrations were 0 µM (squares), 5 µM (diamonds), 15 µM (circles) or 45 µM (triangles). The inset in (a) shows an extended view of the same plot in the region ΔOD408 = 0 for inhibitor concentrations of 5, 15 and 45 µM.

