
Table 2. Data-collection and refinement statistics.
Values in parentheses are for the outer shell.
| Data collection | |
| Resolution limits (Å) | 40–3.5 (3.69–3.5) |
| No. of observed reflections | 1028468 (150011) |
| No. of unique reflections | 196243 (28170) |
| Completeness (%) | 93.3 (93.5) |
| Multiplicity | 5.3 (5.3) |
| 〈I/σ(I)〉 | 5.2 (2.2) |
| Rp.i.m.† (%) | 12.9 (37.4) |
| Refinement | |
| Resolution range (Å) | 15–3.5 |
| Non-H protein atoms | 101742 |
| Non-H ion atoms | 450 |
| Rcryst overall‡ (%) | 23.7 |
| Rfree§ (%) | 28.4 |
| Ramachandran plot | |
| Most favourable regions (%) | 85.3 |
| Allowed regions (%) | 14.7 |
| Generously allowed regions (%) | 0.0 |
| R.m.s. standard deviation | |
| Bond lengths (Å) | 0.002 |
| Bond angles (°) | 0.54 |
†
R p.i.m. is the precision-indicating (multiplicity-weighted) R merge (Diederichs & Karplus, 1997 ▶).
‡
R
cryst = 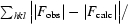
 .
.
§
R free is the cross-validation R factor computed for a test set of 5% of the unique reflections.