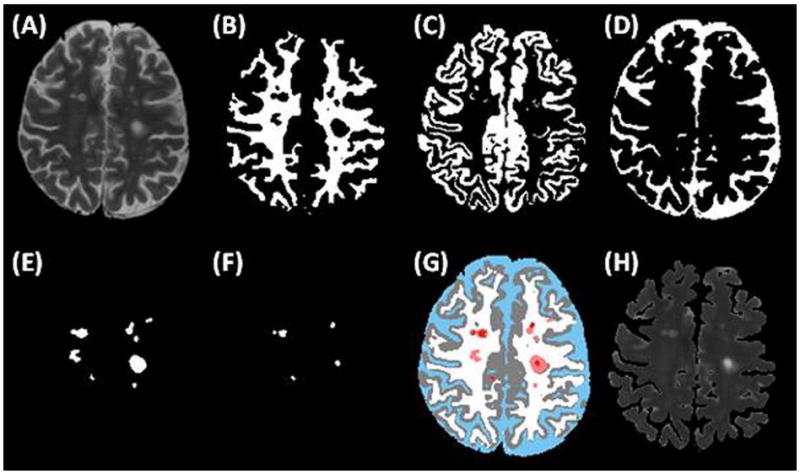
Figure 1.

Segmentation algorithm output for a representative patient anatomic slice: (a) normal T2-weighted image, (b) WM compartment, (c) GM compartment, (d) CSF compartment, (e) T2 lesions, (f) T1 lesions, and (g) a colorized composite map of all compartments, with white for WM, gray for GM, blue for CSF, pink for T2-lesions, and red for T1-lesions. The corresponding T2 map (excluding CSF) is also shown in (h).
