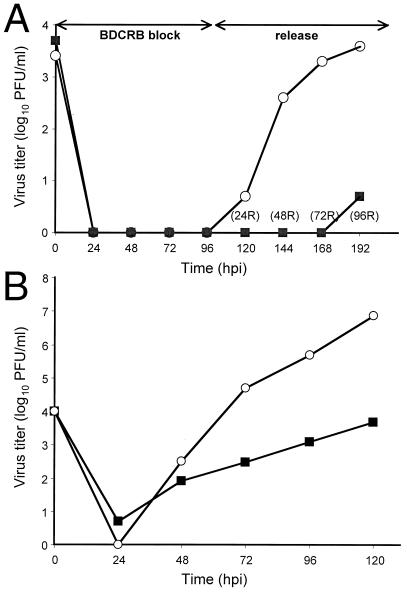
Figure 4.
Growth curves for RCΔ97.08 and AD169. (A) Growth curves during BDCRB block-release. HFs were infected (moi of 0.1), and supernatant progeny virus were harvested at the indicated times after infection or after drug release (R) and titered on HF monolayers. (B) Growth curves for RCΔ97.08 and AD169. HFs were infected (moi of 1), and supernatant progeny virus was harvested at the indicated times after infection and titered on HF monolayers. ■, RCΔ97.08; ○, AD169.

