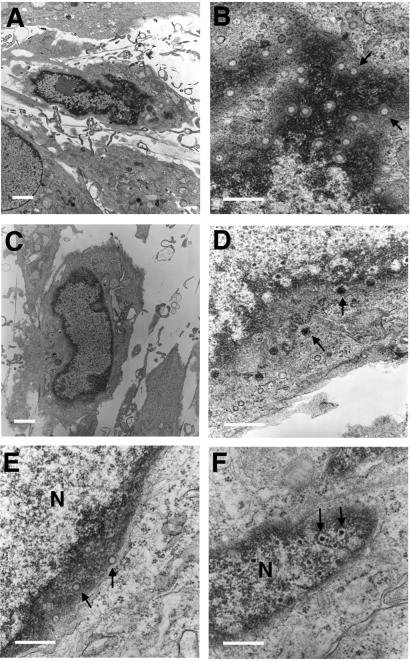
Figure 6.
Transmission electron micrographs of virus-infected cells at 72 hpi. (A and B) HFs infected with mutant RCΔ97.08. (C and D) HFs infected with strain AD169. (E) U373-vec cells infected with mutant RCΔ97.08. (F) UL97–9 cells infected with mutant RCΔ97.08. Arrows in B and E point to empty A capsids. Arrows in D and F point to DNA-containing capsids. [Magnification: A and C, ×3,800; B, D–F, ×35,000. Size bars: A and C, 5 μm; B, D–F, 1 μm.]

