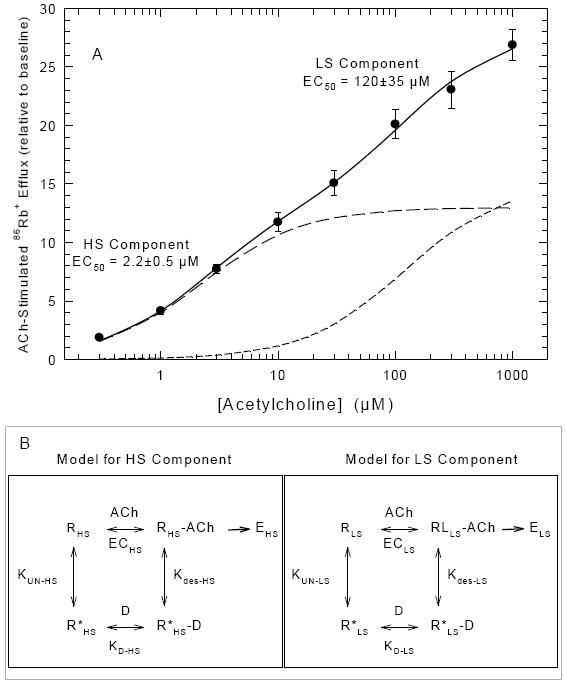
Figure 1. Concentration-Effect Curve for ACh Simulated 86Rb+ Efflux and Katz-Thesleff Models for HS and LS Activity.

The upper panel of this figure shows the ACh concentration effect curve for stimulation of 86Rb+ efflux. Each data point represents the mean ± SEM for six independent studies. The solid line is the fit of the data to a two component model as described in the methods. The two dashed lines are the individual theoretical curves for the HS and LS components. The cyclical Katz-Thesleff diagrams in the boxes below the main figure illustrate the model used to evaluate the desensitization data. HS and LS 86Rb+ efflux observed following stimulation at each [ACh] are designated EHS and ELS, respectively. The ACh concentrations that elicit 50% maximal HS and LS 86Rb+ efflux are designated, ECHS and ECLS, respectively. The apparent KD for binding of the ligand (D) to the unliganded desensitized state of the receptor subtypes (R*HS and R*LS) are designated KD-HS and KD-LS. KUN-HS and KUN-LS are the equilibrium constants between the unliganded ground state (RHS and RLS) and unliganded desensitized state (R*HS and R*LS) and Kdes-HS and Kdes-LS are the equilibrium constants between the liganded active receptors (RHS-ACh and RLS-ACh) and the liganded desensitized receptors.
