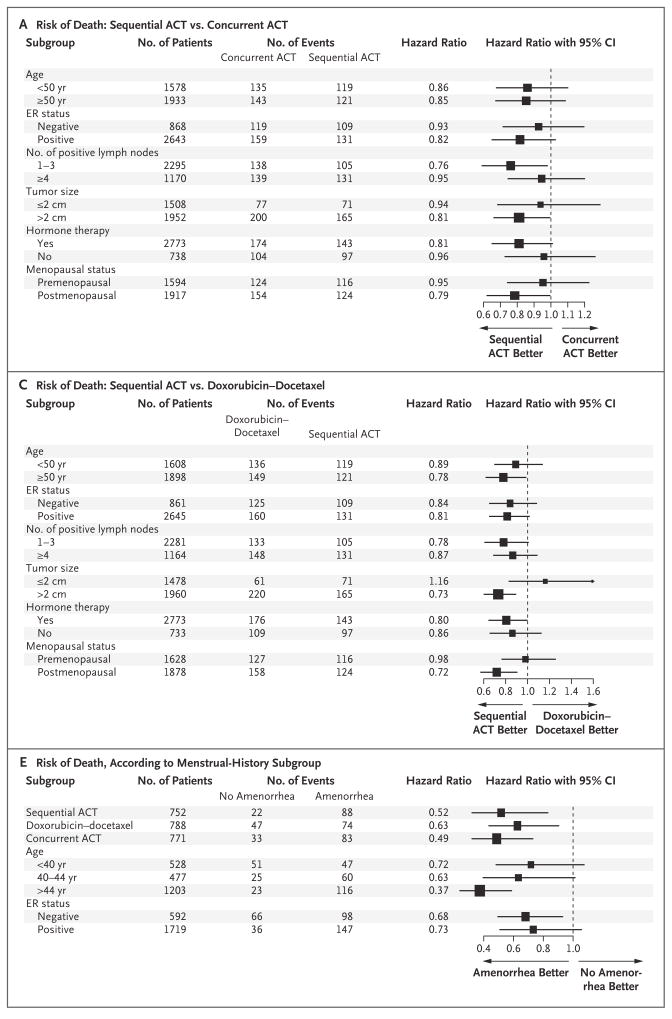
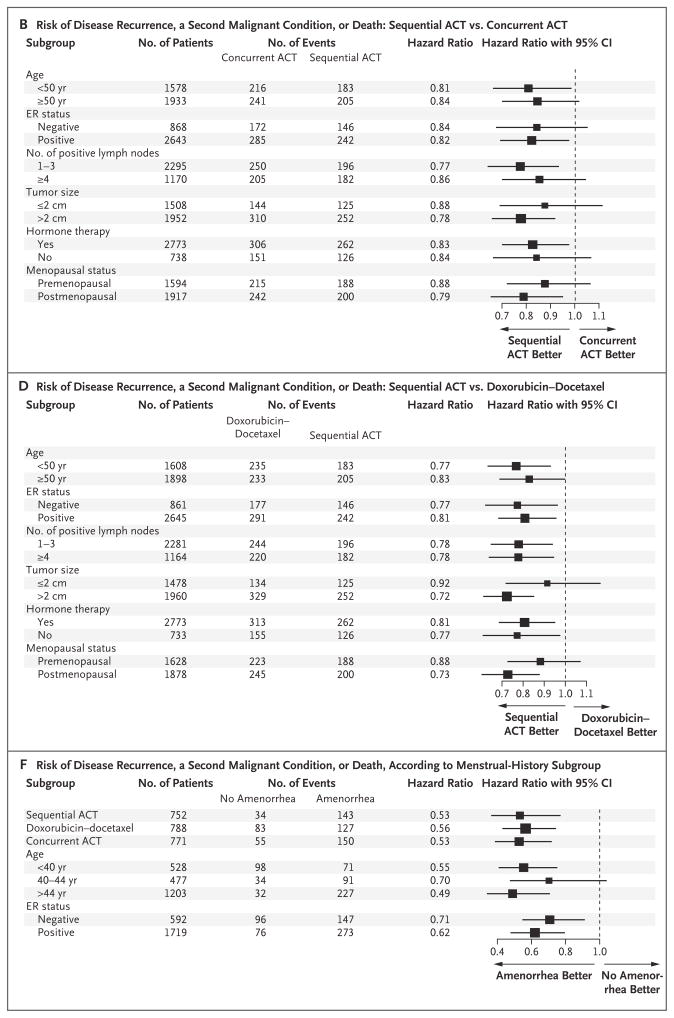
Figure 3. Hazard Ratios for Various Subgroups, According to Treatment.
Panel A shows the reduced risk of death associated with doxorubicin and cyclophosphamide followed by docetaxel (sequential ACT) as compared with concurrent administration of all three agents (concurrent ACT). Panel B shows the reduced risk of disease recurrence, a second malignant condition, or death associated with sequential ACT as compared with concurrent ACT. Panel C shows the reduced risk of death associated with sequential ACT as compared with doxorubicin–docetaxel. Panel D shows the reduced risk of disease recurrence, a second malignant condition, or death associated with sequential ACT as compared with doxorubicin–docetaxel. Panels E and F show data from the menstrual-history study. Panel E shows the risk of death according to subgroups, adjusted for lymph-node status and tumor size. Panel F shows the risk of disease recurrence, a second malignant condition, or death according to subgroups, adjusted for lymph-node status and tumor size. The size of the squares is proportional to the size of the subgroups. CI denotes confidence interval, and ER estrogen receptor.


