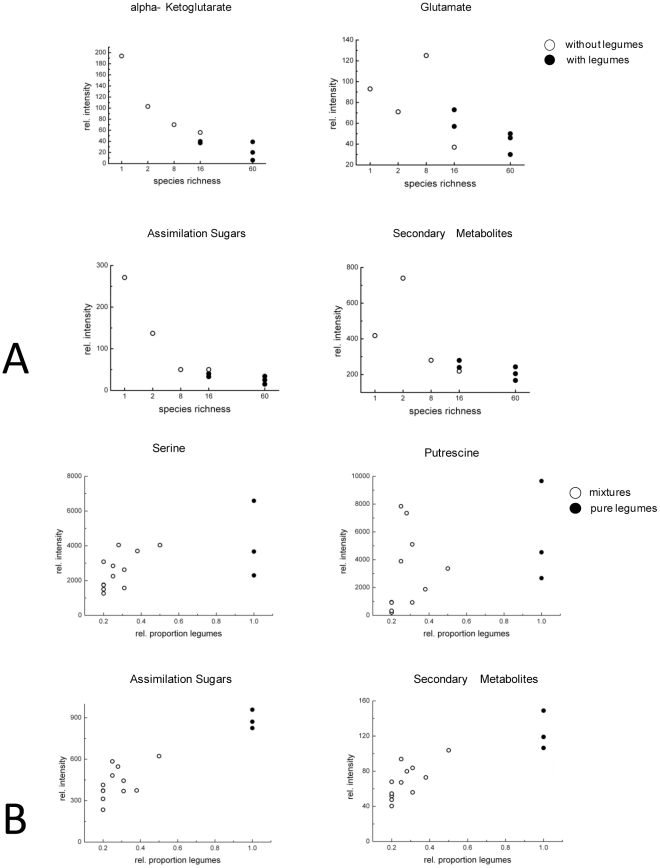
Figure 2. Correlation of key metabolites to species richness and legume abundance.
A Relative intensities of key metabolites plotted against plant species richness for small-statured non-leguminous herb Bellis perennis. White circles symbolize plots without legumes; black circles symbolize plots with legumes. B Relative intensities of key metabolites plotted against relative legume proportions for the small-statured legume Lotus corniculatus. White circles symbolize plots with non-legumes; black circles symbolize plots where the plants were grown in monoculture or in pure legume mixtures.

