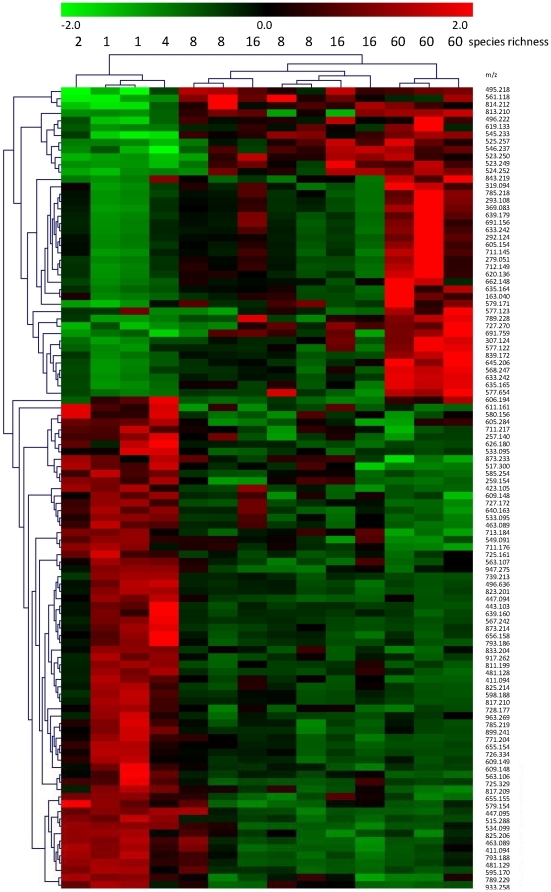
Figure 3. Significant changes in secondary metabolites of L. corniculatus in response to plant species richness.
A color-coded display of significant changes in the metabolite level (relative changes; data are standardized) is given where green indicates a down-regulation and red indicates an up-regulation; exact masses of possible metabolites are shown on the right side. Test on significant differences among three groups of samples resulting from cluster analysis were performed with Kruskal-Wallis tests (selected FDR limit = 0.05; Bonferroni adjustment); clustering was based on Euclidean distance and average linkage. Group 1 (n = 4) summarizes communities with 1 to 4 species; group 2 (n = 4) are communities with 8 species; group 3 (n = 6) are communities with 16 and 60 species. A pre filtered data matrix was applied to the test and resulted in 109 significantly changed m/z and 725 non-significantly changed m/z.

