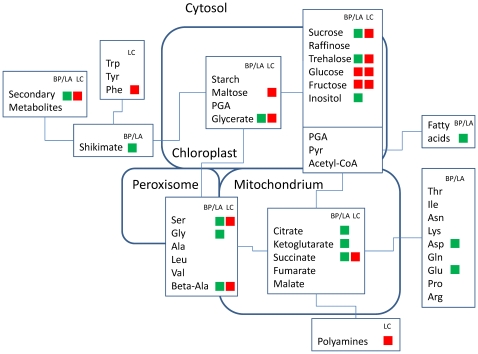
Figure 4. Metabolic signatures of the primary metabolism of small-statured plant species in response to plant diversity.
Significant changes were symbolized via heat map (red = relative increase in response to plant diversity; green = relative decrease in response to plant diversity). BE/LA corresponds to relative metabolite concentration changes of Bellis perennis and Leontodon autumnalis in response to species richness. LC corresponds to relative metabolite concentration changes of Lotus corniculatus in response to increasing proportions of legumes.

