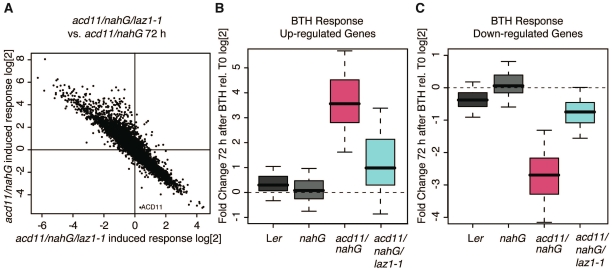
Figure 2. Transcriptome analysis of laz1.
(A) Comparison of the global expression fold change between acd11/nahG and nahG with the fold change between acd11/nahG/laz1-1 and acd11/nahG 72 hr after BTH treatment. This showed a strong opposite response with a Pearson correlation of −0.93. (B, C) Box plots of the expression of the 500 most significantly up- (B) or down-regulated (C) genes in BTH-treated acd11/nahG. The genes exhibit only moderate responses in acd11/nahG/laz1 plants.

