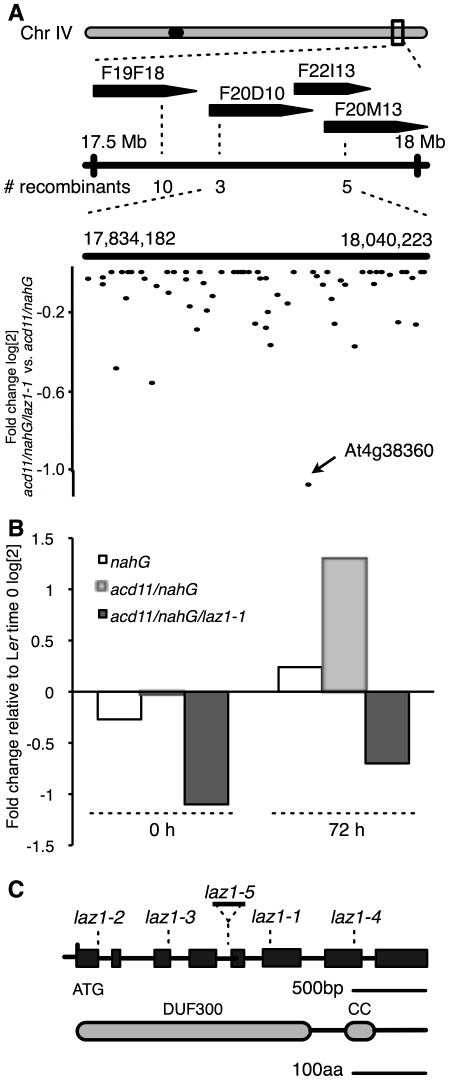
Figure 3. Map-Based Cloning of LAZ1.
(A) Map of the LAZ1 locus on chromosome 4. Positions of markers on three BACs for mapping laz1-1 to a 200 kb interval are indicated (see Table S2 for primers) with the numbers of recombinants. Lower panel shows differential expression of genes within the interval measured by transcript profiling. This identified At4g38360 as the gene in the interval with the most reduced expression between acd11/nahG/laz1-1 and acd11/nahG (log2 fold change with expression intensity ceiling set to 0). The probe set for At4g38360 is indicated. (B) Expression profiling of At4g38360 depicted relative to Ler before treatment (0 hrs). As determined by 2-way ANOVA with the factors treatment and genotype, At4g38360 transcripts accumulated (p-value = 0.018) in acd11/nahG upon BTH treatment (72 hrs), but were not induced in acd11/nahG/laz1-1 or background controls. Similarly, At4g38360 was significantly induced in the acd11 mutant (p = 0.00059; determined by t-test, data not shown). (C) Structure of LAZ1 including positions of the laz1 mutations identified in the screen and the T-DNA integration site of laz1-5 (SALK_034193). The coding region and protein domains (DUF300, domain of unknown function 300; CC, coiled-coil) are boxed. laz1-1 is a γ-induced, one-base pair deletion in exon 6 leading to a premature stop codon (see Figure S3A). laz1-4 has an EMS-derived G->A resulting in conversion of a plant conserved Aspartate to Asparagine (D360N). The base pair changes in DEB induced laz1-2 (T->A) and EMS-induced laz1-3 (G->A) lead to mutations in splice donor sites of introns 1 and 3, causing deletions in preceeding exons (see Figure S3B–C).

