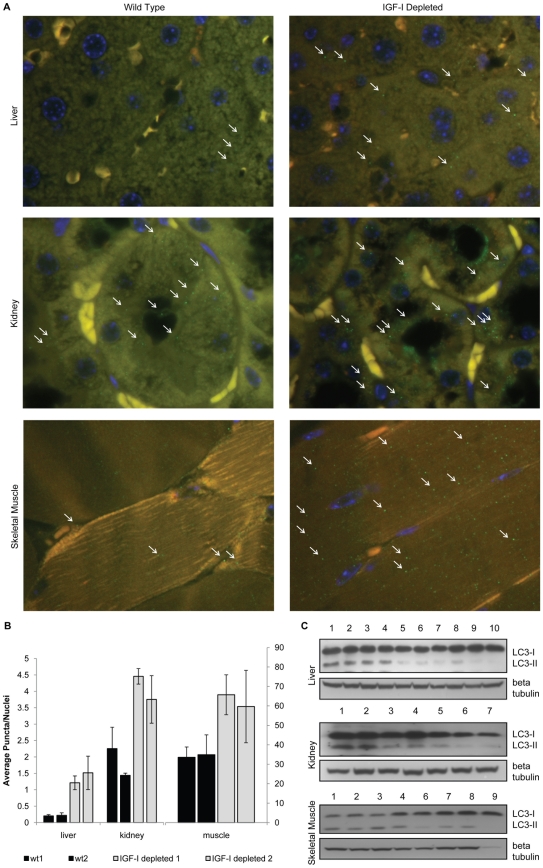
Figure 7. IGF-I-depleted mice show markers of increased autophagy.
Tissue sections from IGF-I deficient mice and controls were examined for LC3 containing puncta as described in the Material and Methods section. A. Representative fluorescence micrograph of liver, kidney, and quadriceps tissue slides from wild type and IGF-I-depleted mice stained with anti-LC3 rabbit polyclonal antibody. B. Number of LC3 puncta per nuclei in tissues from wild type and IGF-I-depleted mice. At least 100 nuclei and 25 fields per slide were examined. C. Western blot analysis of LC3 protein levels in liver, kidney, and skeletal muscle tissue lysates. 1,2,3: IGF-I-depleted mice starved for 24 hours. 4,5: IGF-I-depleted mice fed. 6,7,8: wild type mice starved for 24 hour. 9,10: wild type mice fed.

