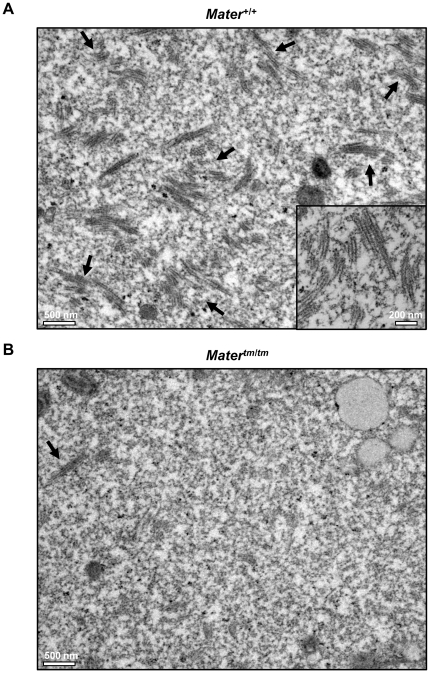
Figure 3. EM analysis reveals that the volume fraction of CPLs is reduced in Matertm/tm oocytes.
(A) Representative TEM image (x11,500) of the ultrastructure of Mater+/+ GV oocytes. A high magnification (x26,500) image of the lattice structure is shown in the inset. (B) Representative TEM image (x11,500) showing the ultrastructure of Matertm/tm GV oocytes. Arrows in A and B indicate CPLs.

