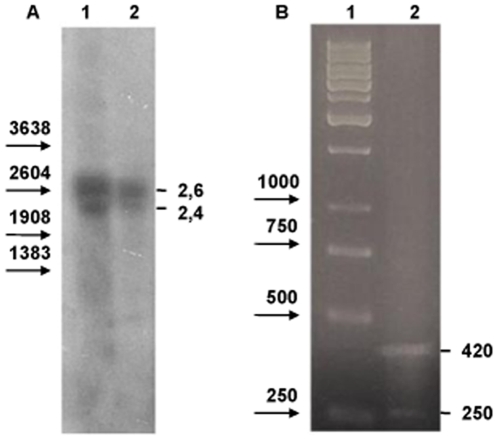
Figure 2. Molecular analyses of Lim3A.
(A). Northern blot analysis of Lim3A. Lanes 1 and 2 present RNA from 12 hr embryos of two different homozygous substitution Drosophila lines. PCR fragment including the 5′ region and the first exon of Lim3A was used as a probe. The mobilities of standard DNA markers (Promega) are depicted by arrows on the left. The approximate sizes of the transcripts are indicated in kilobases on the right. (B). 5′ RACE analysis of Lim3A. Lane 1 is a 1-kb DNA ladder from Fermentas. Lane 2 represents 5′ RACE products, sizes are indicated in base pairs on the right.

