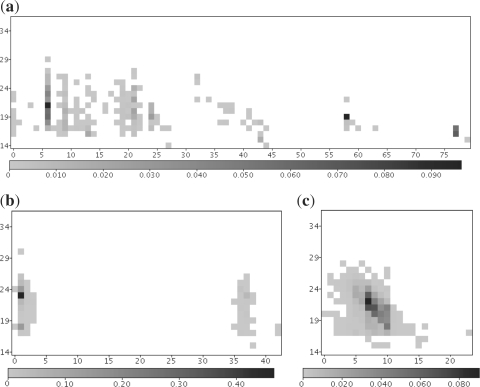
Fig. 1.
Typical position and length-dependent pattern matrices for (a) a tRNA (Gly/GCC), (b) a miRNA (mir-423) and (c) a snRNA (U2). Frequencies of reads starting at position (x-axis) and of length (y-axis) are visualized in different shades of gray. Note that both the snRNA and the tRNA could easily be mistaken for a miRNA, if only the most abundant read is considered. Graphical respresentations for all pattern matrices are available on the project web site.

