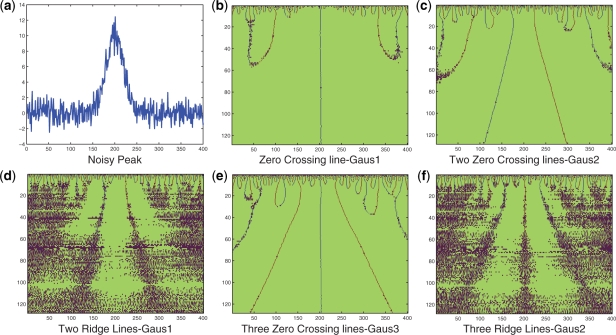
Fig. 1.
An illustration of zero-crossing lines and ridge lines comparison. (a) A peak sample with shape followed ( ) and Gaussian noise (SD = 1); (b) Using Gaus1, the zero-crossing line corresponds to peak position, t = 5; (c) Using Gaus2, two zero-crossing lines correspond to two peak edges whose distances to peak position are σi = 0.5; (d) Using Gaus1, two ridge lines are corresponding to two peak edges whose distances to peak position are σi = 0.5; (e) Using Gaus3, three zero-crossing lines are corresponding to one peak position and two peak edges whose distances to peak position are
  ; (f) Using Gaus2, three ridge lines are corresponding to one peak position and two peak edges whose distances to peak position are
  .
.

