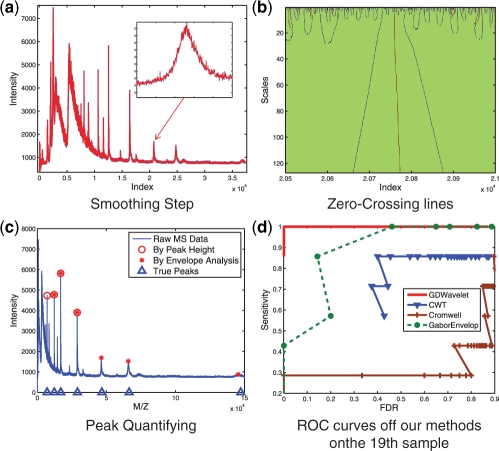
Fig. 3.
An Illustration of GDWavelet. The 19-th sample of (CAMDA, 2006) dataset is selected to illustrate how GDWavelet method detects MS peaks. (a) Blue signal is raw signal and red one is signal smoothed by bivariate shrinkage estimator in wavelet domain. (b) Parameters of peaks are estimated by zero-crossing lines. This figure shows zero-crossing lines of one zoomed peak in (a). (c) Peaks are quantified by peak height and PR. Union results include peaks with heights larger than a threshold or with PRs as one. (d) ROC curves of four methods' performance on the 19-th sample of CAMDA (2006) dataset. GDWavlet gives the best performance.

