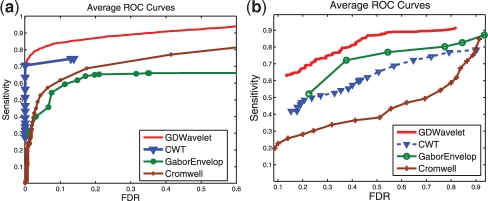
Fig. 5.
ROC curves—simulated data with real noise and real data. Average ROC curves of four methods (Cromwell, CWT, GaborEvelop and GDWavelet). (a) Obtained from 100 simulated MS signals in which real noise is used. There are 20–30 true peaks in this data. (b) Obtained from 60 MS signals (CAMDA, 2006). There are seven true peaks in this data.

