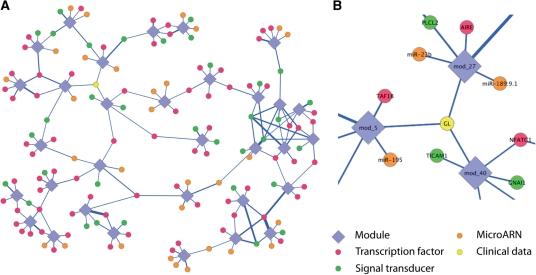
Fig. 2.
(A) Simplified representation of the module network inferred by the LeMoNe algorithm. Clusters of co-expressed genes have diamond shapes, while regulators are symbolized by circles. The color of the circle correspond to a given type of regulator. The thickness of the edges is proportional to the score of a regulator for a given module. For clarity, some clusters are not represented and we have limited the regulators to six per module. (B) Zoom on the module network representation. The yellow regulator labeled GL represent a clinical parameter, the Gleason score, which is connected to three different clusters.

