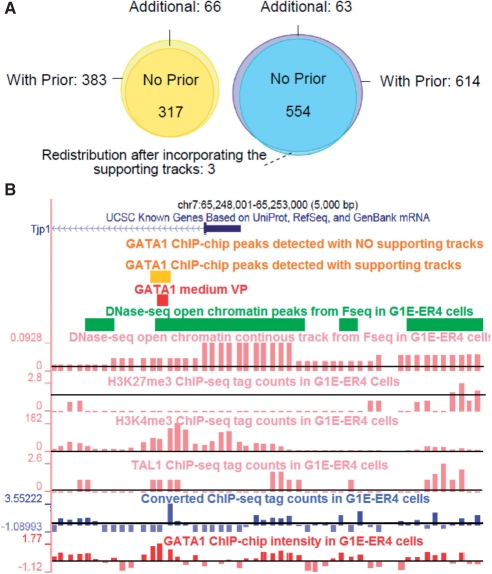
Fig. 5.
(A) Venn diagram of the ChIP-chip and ChIP-seq peaks identified with and without the supporting tracks. (B) An example of a novel GATA1-occupied segment within Tjp1 identified by our method. It was missed by previous HD2 ChIP-chip and ChIP-seq analysis (Cheng et al., 2009). This region also shows depleted H3K27me3 and enriched H3K4me3 signals. Horizontal black lines indicate signal means.

