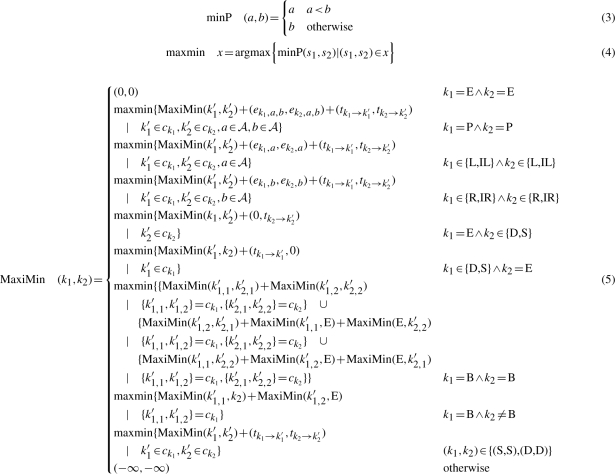
Table 1.
Recursive calculation of the maximal score achieved by an input string common to both model m1 and m2
 |
We abuse notation quite a bit to reduce notational clutter. The state type of model 1 at index k would be  but we write k1 = E to determine if the state is an end state. Additional data structures are simplified as well. The states into which a transition is possible (the children of state k) are written ck1 instead of c1k1. Emission scores for each model are in the matrix e which is indexed by the state k and the nucleotide(s) of the emitting state. Transition scores for transition from state k to k′ are found in the matrix t. The case where k1 = E ∧ k2 = E terminates the recursion, as each correctly built covariance model terminates (each submodel) with an end-state (E) (cf. Fig. 2). Addition of pairs happens element-wise: (a, b) + (c, d) = (a+b, c+d).
