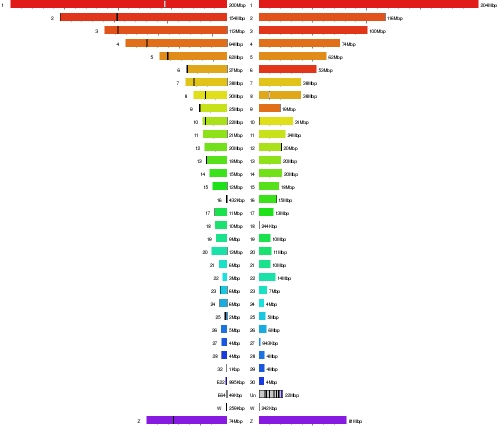
Figure 1. Synteny map of chicken (left) and turkey (right).
Each chromosome is assigned a color in the chicken chromosome, ranging from red (Chr 1) through the spectrum to yellow, green, and blue. Turkey chromosomes are shown using the same colors, indicating differences due to chromosome numbering; e.g., turkey Chr 8 matches chicken Chr 6. The figure shows that there have been no large-scale chromosomal rearrangements in either species since their divergence.

