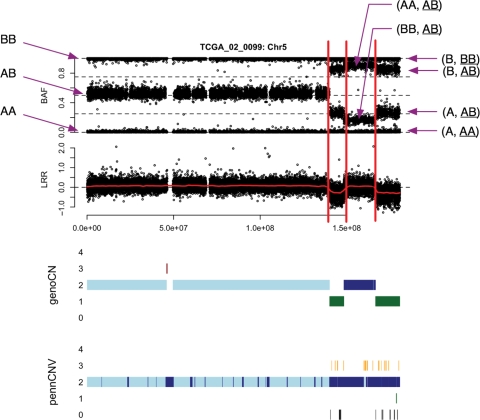
Figure 1.
BAF and LRR of chromosome 5 of TCGA sample 02_0099, as well as the results of genoCNA and PennCNV. The y-axis of the results of genoCNA/PennCNV corresponds to copy number. For a certain copy number, there may be different states, which are distinguished by different colors. In this example, for copy number 2, ‘light blue’ and ‘dark blue’ indicate States 1 and 2 of genoCNA, respectively. When copy number is 3, ‘orange’ and ‘dark red’ indicate States 5 and 6 of genoCNA, respectively.

