Figure 1.
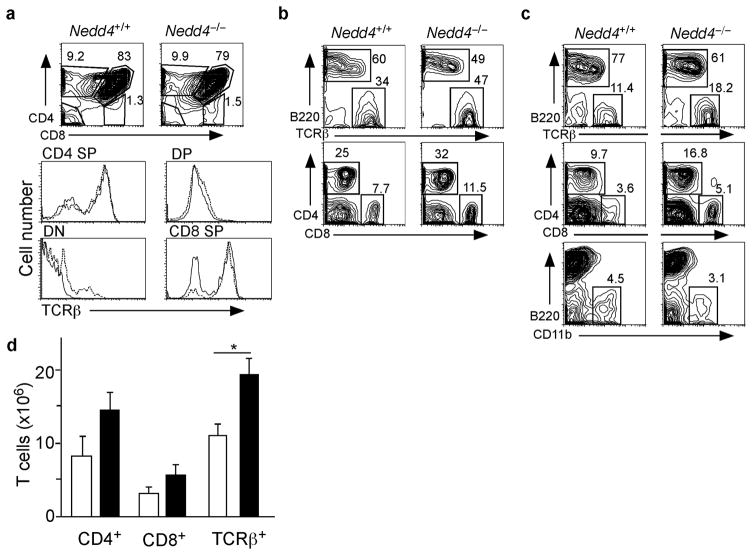
Phenotypic analysis of Nedd4+/+ and Nedd4−/−cells isolated from thymus, lymph node and spleen. (a- c) Cells were isolated from (a) thymus, (b) lymph node, and (c) spleen and stained with antibodies that recognize indicated surface proteins on T cells (CD4, CD8, TCRβ), B cells (B220), or dendritic cells (CD11b). Representative FACS plots are shown. Numbers indicate percentages of each subset (boxed) among live cells. (d) Based on the FACS analysis, total numbers of T cells per spleen were enumerated using antibodies that recognize CD4+ T cells, CD8+ T cells or all TCRβ+ cells. White bars represent Nedd4+/+ cells and black bars represent Nedd4−/−cells. This phenotypic analysis of immune cell populations was performed on tissues from 6–8 fetal liver chimeras of each genotype. * P = 0.038

