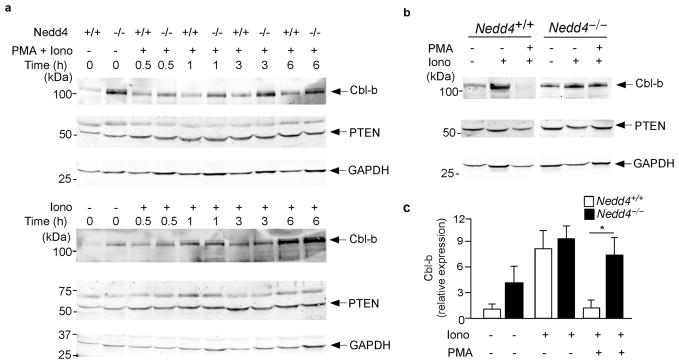
Figure 5.
Nedd4−/−CD4+ T cells express normal amounts of PTEN and increased amounts of Cbl-b. (a, b) T cell lines were generated from Nedd4+/+ and Nedd4−/−fetal liver chimeras and stimulated with PMA and ionomycin or ionomycin alone where indicated. Expression of PTEN, Cbl-b and GAPDH (loading control) was measured by immunoblot. Cells were analyzed (a) 0–6 h or (b) 24 h after activation. Data are representative of 3–5 different experiments. (c) The 24 h Cbl-b data from multiple experiments was quantified, normalized to that of the loading control (GAPDH) and expressed relative to basal amounts in Nedd4+/+ cells. Error bars show s.d. *, P = 0.0001

