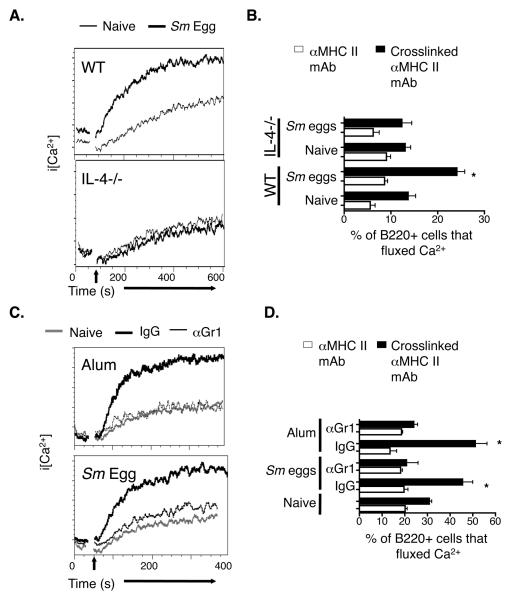
Figure 3. The effects of Sm egg or alum on B cells are dependent upon IL-4 and Gr1 expressing cells.
A. Wild type (WT) and IL-4−/− mice were injected i.p. with nothing (fine black line) or Sm eggs (bold black lines). Six days later, spleen cells were isolated and stained and MHC II crosslinked as described in Figure 2. Shown are the changes in intracellular Ca2+ levels in B220+ cells after MHC II crosslinking. B. Wild type or IL-4−/− mice were injected with nothing or Sm eggs and analyzed six days later as described in Figure 3A. Graphs show the percentage of splenic B220+ cells from either naïve, or Sm egg injected WT or IL-4−/− mice that that fluxed Ca2+ before (white bars) and during the peak (black bars) of the response to avidin mediated crosslinking of their MHC II molecules. C. Mice were injected i.p. nothing (grey lines), alum or Sm eggs (black lines). Alum or Sm egg injected mice were treated with either control rat IgG (bold black lines) or anti-Gr1 mAb (fine black lines). Six days after alum or Sm egg injection, spleen cells were isolated and their MHC II molecules crosslinked as described in Figure 2. Shown are the changes in intracellular Ca2+ levels in B220+ cells after MHC II crosslinking. D. Mice were injected with nothing, Sm eggs or alum, later with control rat IgG or anti-Gr1 and their spleen cells analyzed six days after injection of Sm eggs or alum as described in Figure 3C. Shown are the means +/− standard errors of the percentages of B220+ cells that had increased levels of intracellular Ca2+ before (white bars) or after (black bars) crosslinking of their MHC II proteins. Asterisks indicate a group with a percentage of cells fluxing Ca2+ after MHC II crosslinking that was significantly different from that observed in cells from naïve mice (p<0.05). Results in A and C are representative of two individual experiments and data in B and D are from a representative experiment of three.

