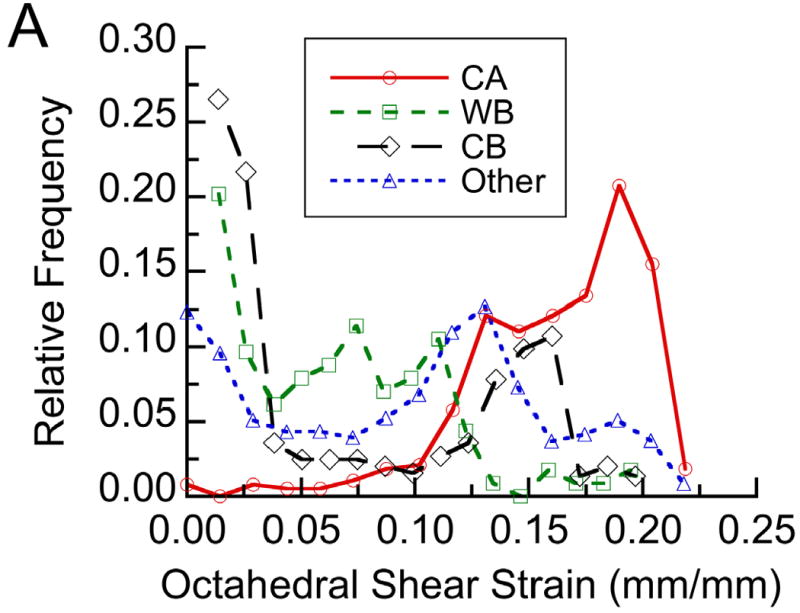
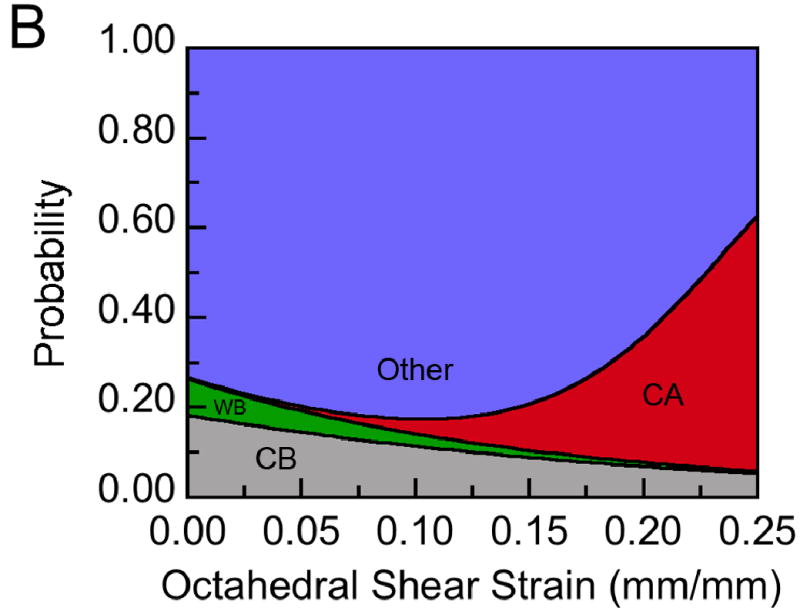
Figure 5.


(A) The distribution of each tissue type within a representative histological section at post-operative day 24 with respect to the average distribution of octahedral shear strain measured at post-operative day 24: The distribution is expressed in terms of relative frequency, defined for each tissue type as the number of grid points experiencing a given value of shear strain and occupied by that tissue type normalized by the total number of grid points occupied by that tissue type. Tissue type is abbreviated as “CA” for cartilage, “WB” for newly formed woven bone, and “CB” for cortical bone (the cortex). No fibrocartilage was found in this section. (B) Results from the logistic regression analysis performed on this histological section: Each tissue type is represented by a color, and the height of the colored area at a given value of octahedral shear strain corresponds to the probability of encountering that tissue type at that value of shear strain. For this section, the probability of encountering cartilage increased, and the probabilities of encountering woven bone and cortical bone decreased, with increasing shear strain (p<0.05).
