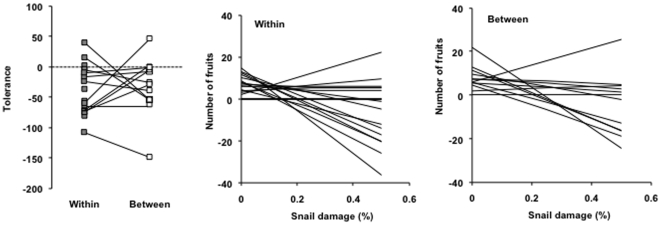
Figure 2. Among-population variation in outbreeding effects on tolerance and plant fitness.
Among-population variation in a) outbreeding effects on tolerance and in the effects of snail damage on the number of fruits produced for b) plants from within-population and c) between-population crosses in the snail herbivory experiment. Tolerance is assessed as slope of fitness (number of fruits) and leaf damage %. Thus, tolerance is given in units of change in the number of fruits per % leaf area damaged. The squares in a) denote slopes for plants from within- (grey symbols) and between-population (white symbols) crosses for each population. The lines illustrate differences in tolerance between plants within-and between population crosses for each population. Tolerance >0 indicates overcompensation, tolerance = 0 full compensation, and tolerance <0 undercompensation. In figures b) and c) each line represents a population.

