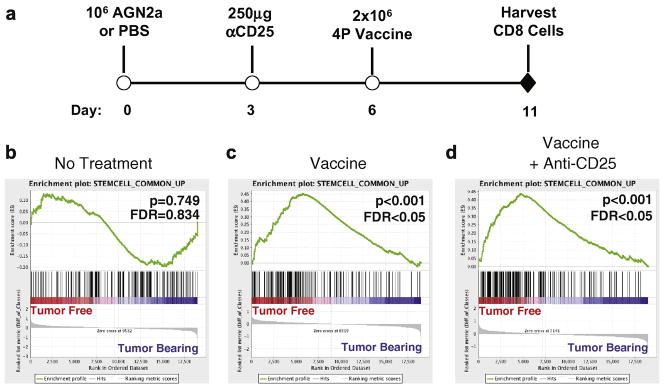
Figure 3. Gene expression profiling of CD8 T cells from vaccinated tumor-free mice showed an enrichment of stem cell-related genes relative to CD8 T cells from vaccinated tumor-bearing mice.
(A) Tumor-bearing and tumor-free mice were generated by the subcutaneous inoculation of 106 AGN2a cells or PBS, respectively, on Day 0. Mice were treated with 250μg of anti-CD25 monoclonal antibody intraperitoneally (Day 3) and/or vaccinated with 2×10⁶ AGN2a-4P vaccine cells given subcutaneously on Days 6. CD8+ splenocytes were collected from 5–6 mice on Day 11 by immunomagnetic cell sorting. RNA was extracted and pooled for gene expression profiling on the Affymetrix GeneChip® Mouse Genome 430 2.0 microarray. GSEA was used to analyze the combined gene expression data of two independent experiments. The “Stemcell_Common_Up” gene set was identified as being enriched in treated tumor-free mice relative to treated tumor-bearing mice. The enrichment profiles of the “Stemcell_Common_Up” gene set are shown for mice given No Treatment (B), Vaccine (C) or Vaccine+anti-CD25 (D). For each enrichment profile, a rank ordered gene list was generated between tumor-free and tumor-bearing mice, in which all genes in the microarray were ordered from highest differential expression in tumor-free (left/red end of bar) to the highest differential expression in tumor-bearing (right/blue end of bar). Black lines represent the location of the “Stemcell_Common_Up” genes in the rank ordered gene list. A summing generates a running enrichment score (green line) which yields the overall enrichment of the gene set at the maximum deviation from zero.

