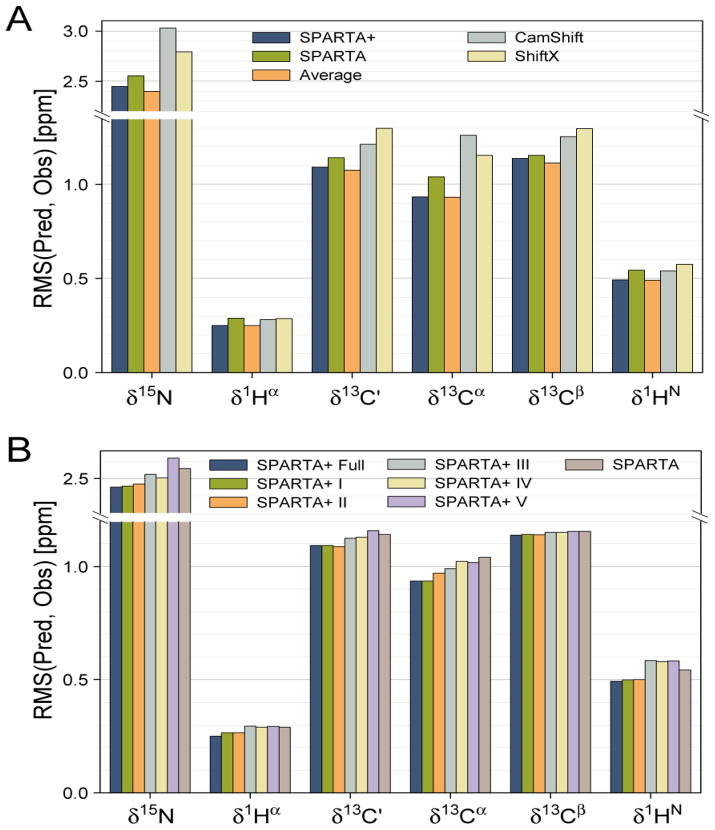
Figure 2.
Chemical shift prediction performance of various methods, evaluated over a set of eleven proteins not included in the neural network training database. The prediction performance (vertical axis) for the 15N, 13C′, 13Cα, 13Cβ, 1Hα and 1HN chemical shifts is represented by the rms difference between the experimental and the predicted chemical shifts. Colors of the bars indicate the program used for predicting the chemical shifts, as marked in the panel. The orange bar corresponds to the weighted average (70%/30%) of the SPARTA+ and SPARTA predicted chemical shifts. (B) Impact of various structural and dynamic input parameters on SPARTA+ chemical shift predictions. Dark blue columns correspond to using the full set of SPARTA+ input parameters; the adjacent 5 bars correspond to input parameters defined in Table 1. The most right hand bar in each set corresponds to the original SPARTA prediction method.

