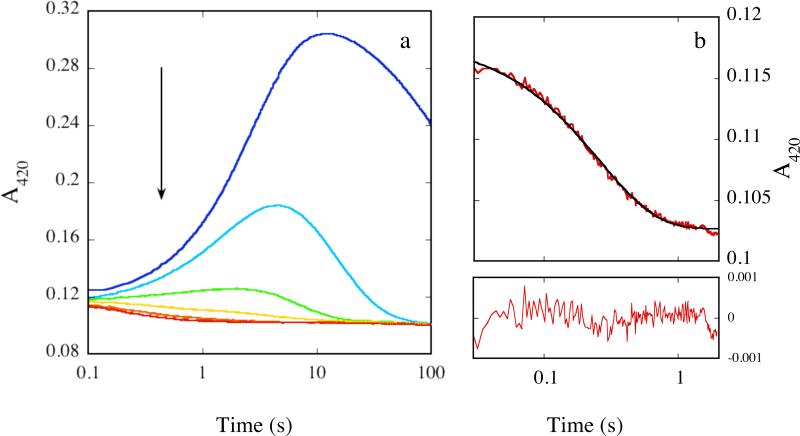
Figure 1.
(a) Representative absorbance profile for the reaction of 50 μM MMOHred with a mixture of excess O2 and CH3CH2CHO in the presence of 2 equiv MMOB at 4 °C and 420 nm. [CH3CH2CHO] = 0 mM (blue), 5.8 mM (cyan), 24.9 mM (green), 69.7 mM (yellow), 122.3 mM (orange), and 214.9 mM (red). Data collected on separate occasions with different batches of protein yielded similar results. (b) Representative fit of data (red line) depicted in (a) collected in the presence of 214.9 mM CH3CH2CHO to a single exponential decay process (black line). Fit residuals are depicted below the plot.

