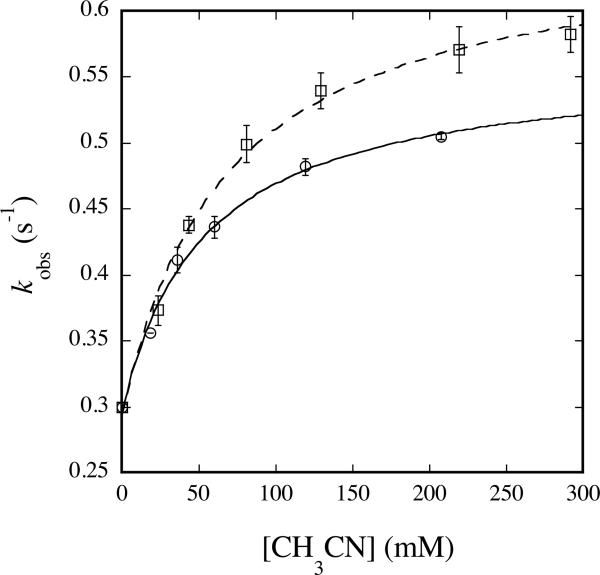
Fig. 5.
Plot of kobs versus [CH3CN] (circles, solid line) or [CD3CN] (squares, dashed line) for reaction with Hperoxo at 4 °C and pH 7.0. 200 μM MMOHred and 400 μM MMOB were mixed rapidly with excess O2, the reaction mixture was aged for 2 s, and then buffer containing the appropriate concentration of acetonitrile was introduced. Data were analyzed as noted in the text. Error bars represent one standard deviation at the 95% confidence level.

