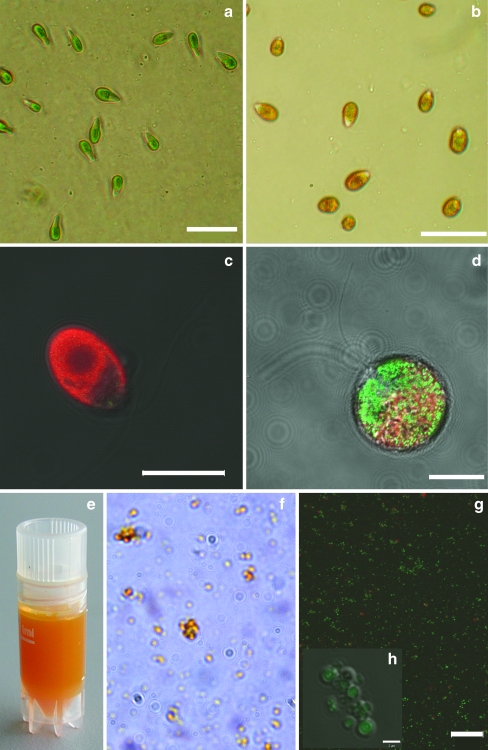
Fig. 1.
a, b Bright field microscopy picture of non-stressed (a) and stressed (b) D. salina cells. Scale bars=20 μm. c, d Fluorescence microscopy pictures (CLSM) of non-stressed (c) and stressed (d) D. salina cells. Scale bars=10 μm. The CLSM pictures are combination images of three channels: DIC microscopy, green fluorescence (505–530 nm) and red fluorescence (>650 nm). e–h Isolated carotenoid-containing globules. e Isolated globules in Tris–HCl buffer (pH 8.0). f Bright field picture of the carotenoid-containing globules. g, h CLSM pictures of the carotenoid-containing globules. Scale bars=10 μm (g) and 2 μm (h). Green fluorescence comes from the globules, red fluorescence from chlorophyll remains

