Figure 3.
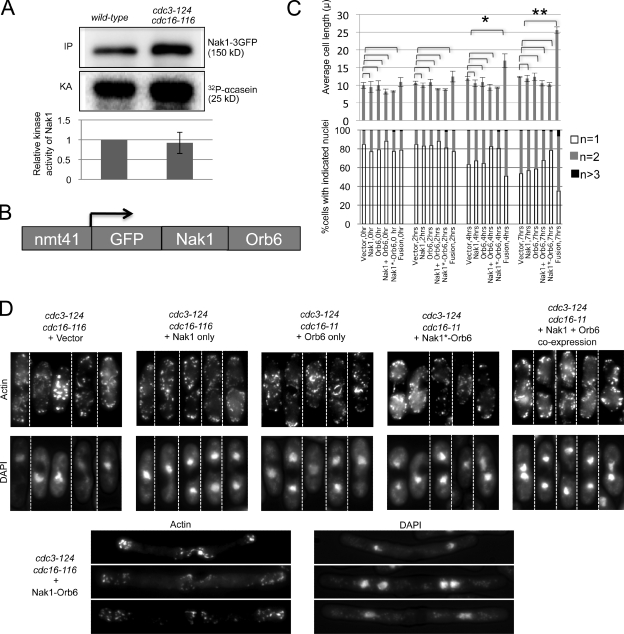
Fusion of Nak1 to Orb6 bypasses SIN inhibition of cell elongation. (A) The SIN does not inhibit Nak1 activity. Wild-type and cdc3-124 cdc16-116 cells expressing Nak1-3GFP from the chromosomal promoter were grown at 25°C and then shifted to 36°C for 3 h before harvesting. Cell extracts were prepared and Nak1-3GFP was immunoprecipitated with anti-GFP (Invitrogen) antibody. The immunoprecipitates were split, with one portion used for Western blotting using GFP antibodies (Santa Cruz Biotechnology, Inc.) (IP), and the other portion for in vitro kinase assays using α-casein (Sigma-Aldrich) as an artificial substrate (Leonhard and Nurse, 2005). The kinase activity (KA) was measured using a PhosphorImager (MDS Analytical Technologies), quantified using ImageQuant software, and normalized to the amount of Nak1 (IP). The activity relative to wild-type cells is shown. The difference in the normalized Nak1 kinase activity between the wild-type and the cdc3-124 cdc16-116 cells was not significant based on t test analysis from three different experiments. Error bars denote SD of the relative KA. (B) Schematic representation of the Nak1–Orb6 fusion construct expressed from the medium strength thiamine-repressible promoter, nmt41. (C) cdc3-124 cdc16-116 cells carrying the indicated plasmids were induced for 19 h in media lacking thiamine and shifted to 36°C; then cells were collected at 2, 4, and 7 h. The plasmids used were the pRep41 vector, or the pRep41 vector carrying Nak1, Orb6, the Nak1–Orb6 fusion (fusion), the Nak1 kinase-dead–Orb6 fusion (Nak1*-Orb6), or the Nak1 and Orb6 genes on separate plasmids (Nak1 + Orb6). Cells were then stained with DAPI and scored for cell length measurements (top panel) and nuclei count (n, bottom panel). Error bars in the cell length plot denote SD of the length measurements obtained from three separate experiments. Average cell length was compared between cells with vector control and those with the different transgenes as indicated in the figure at each time point. Statistically significant increase in cell length (based on P-value calculation by t test analysis) was observed only in cells expressing the fusion construct. *, P = 0.0118; **, P = 0.0001. At least 100 cells were analyzed for each time point. For clarity, the SD values for the nuclear count plot are shown in Fig. S4. (D) cdc3-124 cdc16-116 cells with the indicated transgenes were grown as in C and then processed for actin staining. Montage of representative cells (separated by dashed dividing lines) with actin (phalloidin staining) and nuclei (DAPI staining) staining are shown for the 7-h time point.

