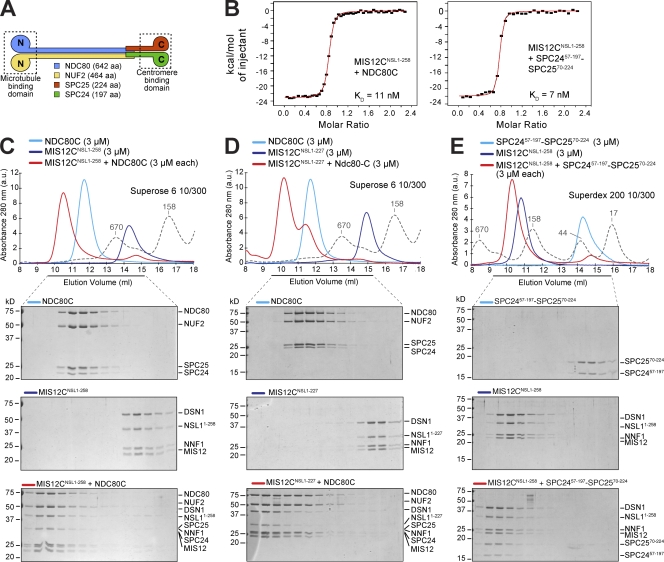
Figure 3.
Interaction of MIS12C with NDC80C. (A) Schematic representation of the NDC80C. (B) Binding curves were measured by ITC by titrating NDC80C (left) or SPC2457–197–SPC2570–224 (right) in a cell containing MIS12CNSL1-258. (C) Size-exclusion chromatography elution profiles and SDS-PAGE analysis of recombinant NDC80C expressed in, and purified from, insect cells (top), MIS12CNSL1-258 (middle), and their stoichiometric combination (bottom). (D) Elution profiles and SDS-PAGE analysis of NDC80C (top), MIS12CNSL1-227 (middle), and their stoichiometric combination (bottom). The MIS12CNSL1-227 construct binds NDC80C. (E) As in C, but with the kinetochore-binding portion of NDC80C, the SPC2457–197–SPC2570–224 construct. (C–E) Dashed gray lines and numbers indicate elution markers in the size-exclusion chromatography experiments and their molecular masses (in kilodaltons), respectively.

