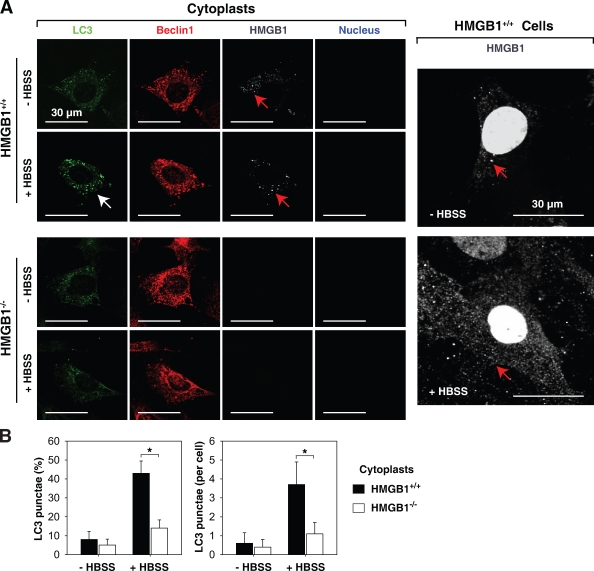
Figure 3.
Inhibition of autophagy by cytoplasmic HMGB1. Hmgb1−/− and Hmgb1+/+ MEFs were enucleated by centrifugation after cytochalasin B treatment as described in Materials and methods and then were treated with HBSS for 3 h, and LC3 punctae formation was detected by a confocal microscope. (A) Representative images of LC3 punctae (white arrows) and HMGB1 (red arrows) in cytoplasts of Hmgb1−/− and Hmgb1+/+ MEFs are depicted. (B) The percentage of cells showing accumulation of LC3 punctae was reported (*, P < 0.05; n = 3). Data are means ± SEM.

