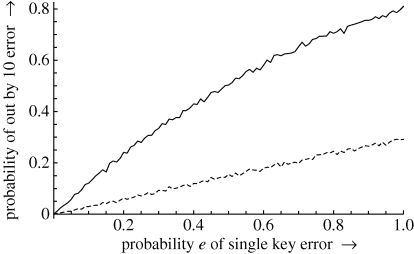
Figure 3.
A plot of the probabilities of an out by 10 error and a blocked out by 10 error as found in a 5000 sample Monte Carlo method as a function of e for k = 10. The solid line shows the behaviour of a calculator-type device (all but the first decimal point is ignored); the dashed line shows the reduction in out by 10 errors by blocking syntax errors. Note that at certainty of error (e = 1), out by 10 errors are not certain; this is because e measures keying error rates, not out by 10 rates. (Some keying errors create numbers that are out by less than 10.)

