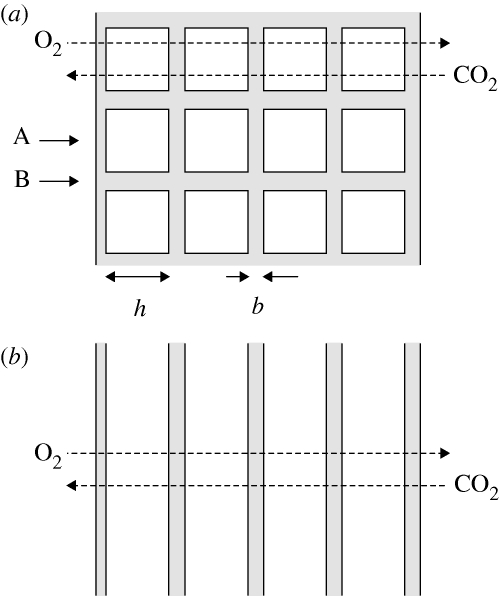
Figure 2.
(a) Simplified picture of the structure of tubular myelin. The repeat unit of this structure according to the CLP model is shown in figure 1b. h denotes the size of the aqueous regions, and b the bilayer thickness. (b) A stack of bilayers with the same dimensions. In both cases, the gas phase is to the left, so that the (overall) gradients of O2 and CO2 are in the directions indicated by dashed arrows.

