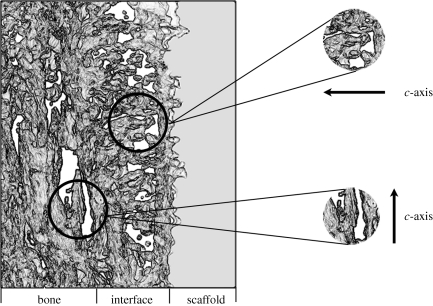
Figure 4.
An illustration of the human bone–scaffold interface indicating the differences in HA crystal orientation visible with electron tomography. Crystals in the bone are oriented with their long axis (c-axis) parallel to the scaffold surface, while crystals in the interfacial apatite layer have their c-axis oriented perpendicular to the scaffold surface.

