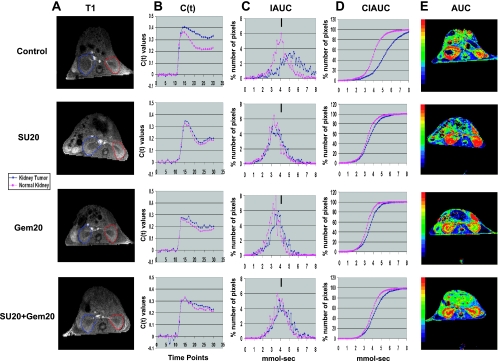
Figure 5.
DCE-MRI imaging of vascular changes induced by gemcitabine and sunitinib in KCI-18 kidney tumors. Separate experimental groups of three mice per group were treated with vehicle only (control), sunitinib only (SU20), gemcitabine only (Gem20), or sunitinib + gemcitabine (SU20 + Gem20). Mice bearing established kidney tumors were pretreated with sunitinib at 20 mg/kg per day (SU20) for 3 days on days 10 to 12 after KCI-18 cell injection in the kidney. Then, mice received three gemcitabine treatments at 20 mg/kg (Gem20) given on days 13, 15, and 17 while continuing daily sunitinib treatments. At 24 hours after the last gemcitabine treatment (day 18), mice were imaged by DCE-MRI for 30 time points at 7-second intervals. (A) T1 images: Baseline images before Gd contrast agent injection. The full kidney was selected as the ROI for the tumor-bearing kidney (blue contour on left of T1 image) and the contralateral normal kidney (red contour on right of T1 image). (B) C(t) kinetics of Gd contrast uptake and clearance: The first 10 time points represent baseline data. Gd was injected at time point 10, and images were collected for 20 more time points. (C) IAUC graphs: Data from the C(t) curves were compiled for 16 time points (112 seconds) after Gd injection to draw IAUC112. The small black bar indicates the peak position of normal kidney in control mice and can be used as a reference for curve shifting in normal kidneys and kidney tumors after treatment. (D) CIAUC graphs: CIAUC graphs were derived from IAUC curves. In graphs B, C, and D, blue lines are for kidney tumors and pink lines are for normal kidneys. Data from a representative mouse from each treatment group are presented. (E) AUC parametric map: Parametric color maps were constructed based on uptake and concentration of Gd in the tissue, represented by the colors blue, green, yellow, and red with gradual increase of Gd from lowest values (blue) to highest values (red). The tumor-bearing kidney is on the left, and the normal contralateral kidney is on the right of the MR images. The color coding in the kidneys are shown for integrated AUC.

