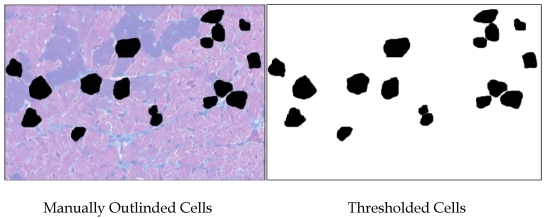
Figure S1.
Methodology used for measuring cardiomyocytes. Areas of 100 cells per group (~33 per heart) were outlined and bucket-filled in Gimp and analyzed in ImageJ. Where cells were adjacent, care was taken to manually make a clean and minimal-width division of their respective areas. Data from all the fields were combined and analyzed in Minitab14®.

